This tutorial will introduce correlation and correlation coefficient. Our discussion breaks down as follows:
- Correlation
- Calculating Using Formula
- Calculating Using Excel Function
- Scatter Plots with Different Correlation Coefficients
1. Correlation
When first describing scatter plots, you learned about their form, direction, and strength.
- Form assessed the linearity
- Direction says whether the data points tend to move in a positive or negative direction
- Strength shows how well they follow that form.
When the form is linear, we can use a number called correlation. It measures the strength and direction of a linear relationship. The direction will be easy to spot. It will be a positive number if there's a positive association, and a negative number if there's a negative association. The numerical quantity will measure strength.
-
In terms of direction, what correlation would do is this: if the explanatory and response variables rise together, that's going to be called the positive direction. If one falls as the other increases, that's going to be called a negative correlation.
The correlation is measured using a numerical value known as the correlation coefficient. The correlation coefficient is a variable called "r" and is unit-less. It is expressed as a number between negative 1 and positive 1 and indicates the strength of the linear association.
Numbers that are close to negative 1 or positive 1 are associated with a strong association between the two variables--a 1 indicating a strong positive association, and a negative 1 indicating a strong negative association. Numbers near zero represent almost no linear relationship.

-
You can use the chart above to help you to understand the value of a correlation. Numbers between 0.8 and 1 are considered to have a strong correlation; between 0.5 and 0.8 a moderate correlation; and between 0 and 0.5 a very weak correlation. The same exists between negative 1 and 0.
-
-
- Correlation
- The strength and direction of a linear association between two quantitative variables.
- Correlation Coefficient
- The numerical value between -1 and +1 that measures the correlation between two quantitative variables.
-
1a. Calculating Using Formula
Correlation is essentially the average of the products of the z-scores for the x's and the y's. The z- scores are the values of x minus the means of x divided by the standard deviation of x. It's the same thing for y.
-
-

-
EXAMPLE
These are destinations that you could go to from the city of Minneapolis-Saint Paul, with the distances away from Minneapolis and the airfare to fly to any of these places.
-
|
Destination
|
Miles
|
Airfare
|
|
Kansas City
|
460
|
379
|
|
Los Angelas
|
1,870
|
377
|
|
Milwaukee
|
338
|
158
|
|
New York City
|
1,167
|
283
|
|
Philadelphia
|
1,141
|
323
|
-
-
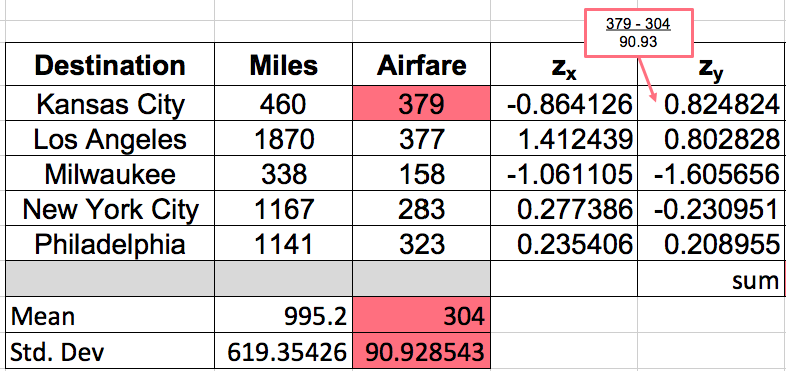
Step 1: Calculate z-scores of the x variable. In this situation, miles is x, or the explanatory variable, as miles are believed to cause airfare to rise. This makes airfare the response variable, y. Take the given miles and airfare and convert both of them into z-scores.
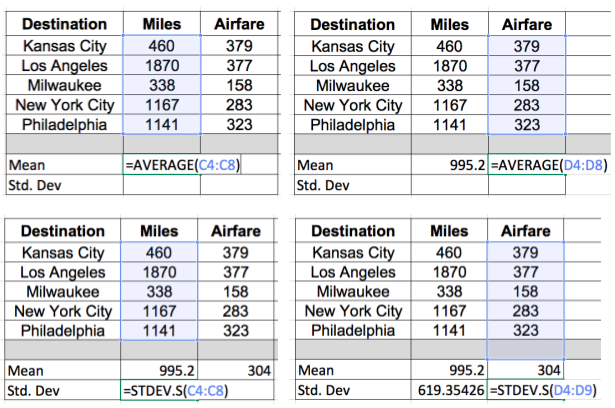
- To do this, you need the mean and the standard deviation. Recall from Unit 3 that you can use Microsoft Excel to easily find these values. For the mean, use the function "=AVERAGE", and for the standard deviation, use the function "=STDEV.S". When using these functions in Excel, you just need to highlight each column that you are finding the mean and standard deviation for. We will do this for both Miles and Airfare.
-

-

- Next, to calculate the z-score, subtract the mean from each value and divide by the standard deviation. For example, using the first value in Miles, take 460 minus the mean, 995.2, and divide by the standard deviation, 619.35. This gives us a -0.864.
-

- Do the same thing for the 1870 miles to Los Angeles, and all of the other cities.
-
Step 2: Repeat this process and calculate the z-scores for the y values. In this scenario, the response variables are the airfare values. Starting with Kansas City, 379 minus 304 divided by 90.93 gives us 0.825.
-

- Do the same thing with all the rest of the airfare.
-
Step 3: Multiply the corresponding z-scores and add. Starting with -0.864 and 0.825, multiply the corresponding z-scores for the x and y variables, all down the rows, then add them up.
-

- The sum here ends up being positive 2.11. We can substitute this value into the correlation formula.
-

-
Step 4: Finally, divide by the number of observations minus 1. There are five observations, so the denominator will be 5-1.
-

- Dividing by four yields a correlation of 0.527. This value tells us that the correlation between airfare and miles is a positive relationship but fairly weak association. We can also see this from the scatter plot:
-

- 1b. Calculating Using Excel Function
This is a very cumbersome process to go through, and the correlation coefficient is almost always found using technology. In Excel, once we have the basic information for miles and airfare listed, all you have to do is type in the command "=CORREL", which is short for correlation. Select all the things believed to be the x's, and all of the things we believe to be the y's. Close the parentheses and hit "Enter."

Sure enough, it gives you the 0.527 that you got before.
2. Scatter Plots with Different Correlation Coefficients
Let's explore some scatter plots with different correlation coefficients.
-
|
Graph
|
Correlation
|
Explanation
|

|
r = -0.99
|
The data points are in a negative direction, so the correlation is a negative number. It is also nearly linear, so its correlation is negative 0.99, which is very close to negative 1. This graph shows a very strong, negative association.
|

|
r = -0.5
|
The data points are in a negative direction, so the correlation is a negative number. However, the data is fairly spread out, so the strength is not terribly strong. This graph shows a weak to moderate, negative association.
|

|
r = 0
|
The data points have a cloudy association, so it is neither positive nor negative. There is also no linear association between the two variables, so the correlation is zero.
|

|
r = 0.7
|
The data points show an upward association, so the correlation is a positive number. Although it is linear, the data points are not very clustered, but still close enough to show a fairly moderate to strong association.
|

|
r = 0.9
|
The data points are in a positive direction, so the correlation is a positive number. It is also very linear, so its correlation will be closer to 1. This graph shows a strong, positive association.
|

|
r = 0.3
|
Even though the points are spread out, a positive association is visible. However, since they are not closely clustered, the data points will show a weaker strength.
|
The correlation only relates the linear relationship between two quantitative variables. As a caution, you're going to hear the word correlation thrown around a lot in everyday speech; however, there are often very common errors made when comparing two different variables. It is always important to make sure the two variables being measured are quantitative.
-
Can you spot the errors in the following statements?
- "There is a strong correlation between Type 2 diabetes, physical inactivity, and obesity."
Although it's possible that they are related, you can't use the word correlation. The first error here is that three variables are being compared, and correlation only compares two variables. Also, Type 2 diabetes is categorical--either you have it, or you don't. Physical inactivity could be quantitative, but it's not obviously quantitative. Obesity is certainly categorical.
- "There is a strong correlation between IQ and religious affiliation."
Although IQ is quantitative, religious affiliation is categorical. You can't calculate the correlation between the two.
Correlation measures the strength and direction of a linear relationship between two variables on a scatter plot. Strong associations have correlation coefficients near positive 1 or negative 1. Scatterplots with weak correlation coefficients are values near zero. Almost always, you can find it using technology, such as a calculator, an Internet Applet, or a spreadsheet. Because of the way that r is calculated, where you're multiplying z-scores, it doesn't matter which variable is called the explanatory and which is the response.
Good luck!


