Table of Contents |
Our subject company, Legacy Clothing, is a sole proprietorship, which is a type of company that is owned by a single individual, and where that individual and the business are legally treated as the same.
The purpose of Legacy Clothing as a business is to own and operate clothing/merchandise stores. It is similar to a department store chain, selling men's, women's, and children's clothing and other related items.
Legacy Clothing has locations throughout Washington, DC, and they have a staff of 50 people employed in their stores.
| Legacy Clothing | |
|---|---|
| Type of company | Sole proprietorship |
| Business purpose | Own and operate clothing/merchandise stores |
| Business location(s) |
Washington, D.C. Staff of 50 people |
Legacy Clothing needs to perform financial analysis. They need to perform vertical analysis because it helps them to understand the relationship between individual accounts and overall revenue, in the case of the income statement, or total assets, in the case of the balance sheet.
They also need horizontal analysis because it aids in their understanding of trends in individual accounts, or how those individual accounts change over time.
Lastly, they need ratio analysis to fully understand their business operating performance in the case of profitability, or their business position and ability to pay debts in the case of liquidity ratios .
Essentially, all three of these types of financial analysis are needed in order for Legacy Clothing to truly understand the state of their business, how it's performing and changing.
Using financial analysis, Legacy Clothing can do a comparison of changes within the company, as well as compare itself to other companies and against industry standards. In this manner, they have a better picture of their business and where they fit within the greater context of the competitive and industry landscape.
In today's lesson, we're going to look at our case study company in performing financial analysis, exploring examples of performing vertical analysis, horizontal analysis, and ratio analysis.
The first piece of analysis we're going to perform is vertical analysis, starting with Legacy Clothing's income statement.
Here is income statement information from both 2012, which for our purposes is the current year, as well as 2011, which is last year.
We're going to look at the relationship of these individual financial statement line items to our base amount, which in the case of the income statement, is net sales.

Next, we take the dollar figures on our income statement and convert them to a percentage of our base amount, for both years. In this manner, we can understand how these individual financial statement line items relate to our base amount, net sales.
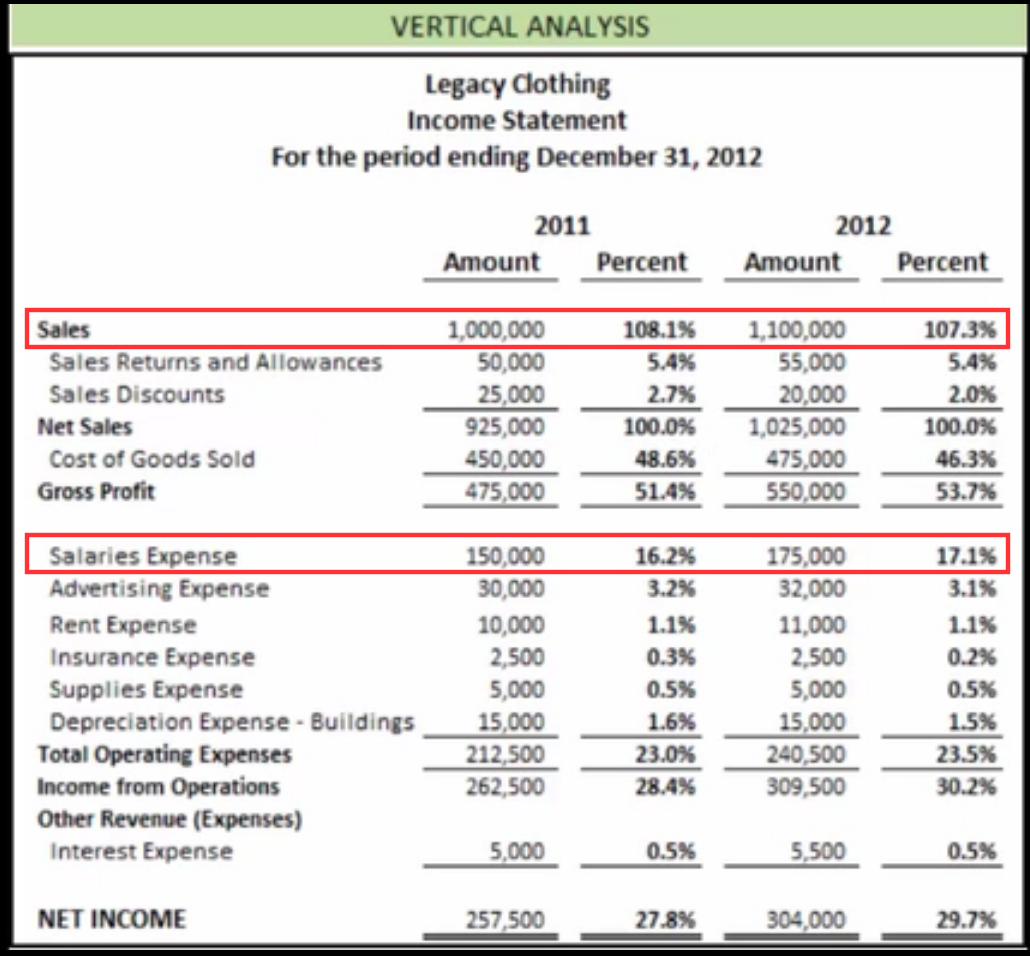
In this case, you can see that salary expense is 16% of our net sales in 2011, but the following year, it represents 17% of net sales. This allows us to see its changing composition over time.
Another example is sales. In 2011, our sales represented 108%, and it decreased to 107% in 2012.
Now we can perform our vertical analysis for Legacy Clothing's balance sheet, performing the same type of exercise as we did with the income statement.
Once again, we're going to express these individual accounts, or financial statement line items, as a percentage of a base amount. In the case of the balance sheet, the base amount is our total assets.

We express each line item as a percentage of that base amount. Note that total assets is 100%.
By expressing each line item as a percentage of the base amount, we can understand the composition of these line items, as well as any changes over time.

For example, notice that in 2011, our merchandise inventory represented 21% of our total assets, whereas in 2012, it represents a little more than 25%.
In another instance, notes payable represented 35% of our total assets in 2011 and 30% in 2012; therefore, notes payable is going down, which makes sense.
Now we're going to turn our attention to our horizontal analysis, which will help us understand trend in the individual financial statement line times and how they are changing over time.
Again, we're going to start with the income statement for our subject company.

First, we express the changes from 2011 to 2012 in dollar amounts for each of these individual financial statement line items.

Now, once we have this information, we can convert those amounts to a percentage increase or decrease, so that we can understand how these individual lines are changing.
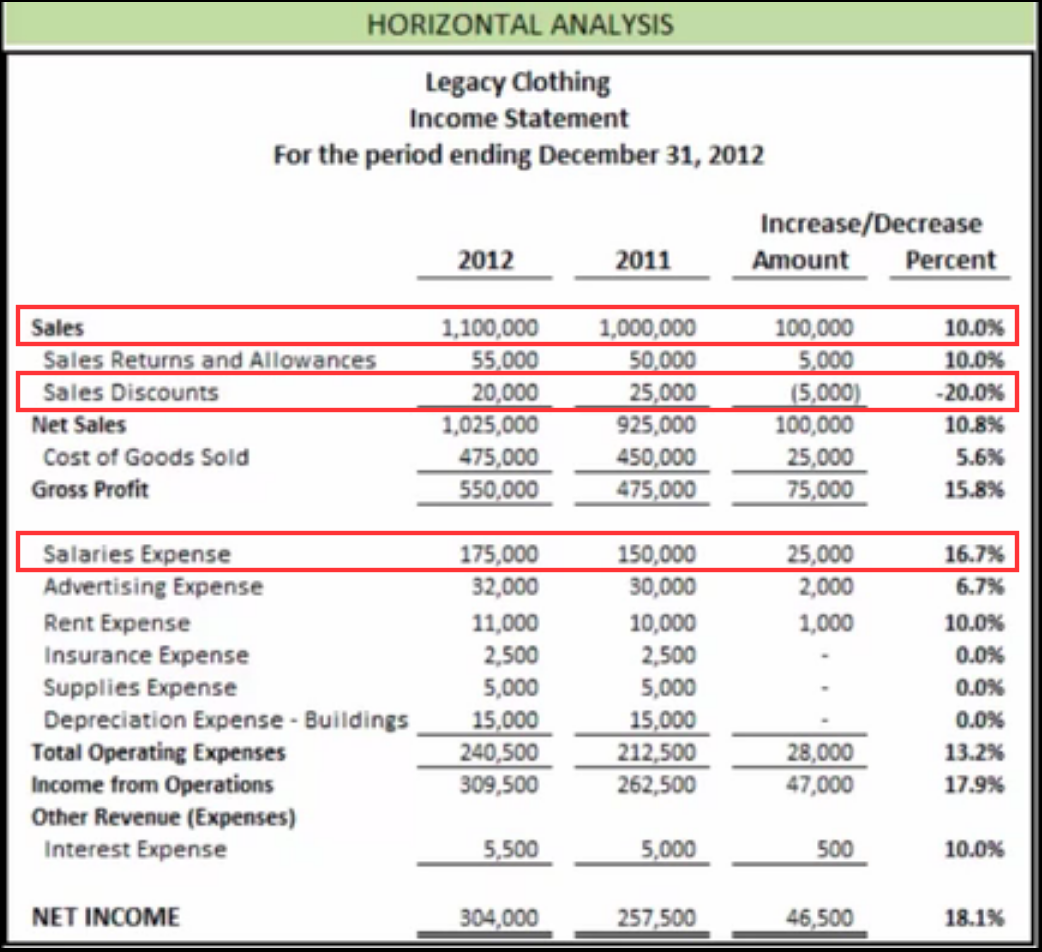
In this case, we can see that our sales are going up 10%. However, our sales discounts actually went down 20%, which means we are issuing less discounts. Also, we can see that our salaries have gone up 16.7% from 2011 to 2012.
Next, let's perform horizontal analysis on Legacy Clothing's balance sheet.
Once again, we are looking at the individual financial statement line items on the balance sheet and how they are changing from one year to the next.

The first thing we do is to express that change in dollars, whether an increase or decrease, for each of these individual financial statement line items.

Next, we convert that dollar amount change to a percentage, to show us the percentage change of these individual financial statement line items.

As you can see, our cash position went up 60% and merchandise inventory increased 25%. However, notes payable went down 7%, which tells us that we are paying our notes payable down.
The last type of analysis that we're going to be performing today for our subject company is ratio analysis.
Let's start with our profitability ratios, which measure the operating performance of the company.
We will calculate three different profitability ratios: rate of return on sales, return on total assets, and asset turnover.

Rate of Return on Sales
So, if we look at rate of return on sales--net income divided by net sales--and input our figures for our subject company, we can see that our rate of return on sales is 29.7%.

Return on Total Assets
Return on total assets measures how effectively we are using our assets, expressed as income before interest expense and taxes, divided by total assets. Plugging in our information, our return on total assets for Legacy Clothing is 31.6%.

Asset Turnover
Asset turnover measures the use of assets to make sales, calculated by taking net sales divided by total assets. In this case, the asset turnover is 1.0 times.

The last piece of our ratio analysis is to look at liquidity ratios for our subject company. Liquidity ratios measure the ability of our company to pay their debts when they are due.
We will calculate both the current ratio as well as inventory turnover.

Current Ratio
The current ratio shows how much in current assets we have to pay off our current liabilities, or short-term debt obligations. Plugging in the information from Legacy Clothing's--current assets divided by current liabilities--we can see that the current ratio is 3.74.

Inventory Turnover
Inventory turnover tells us the number of times inventory is sold and replaced during the period, expressed as cost of goods sold divided by average inventory. One more time, we input the information for our subject company and calculate that inventory turnover is 2.1 times.

Source: Adapted from Sophia instructor Evan McLaughlin.