Table of Contents |
The subject company for our case study is called Legacy Clothing. Legacy Clothing is a sole proprietorship, which is a company that is owned by a single individual, and where that individual and the business are legally treated as the same.
The purpose of Legacy Clothing as a business is to own and operate clothing/merchandise stores. It is similar to a department store chain, selling men's, women's, and children's clothing and other related items. Legacy Clothing has locations throughout Washington, DC, and they have a staff of 50 people employed in their stores.
| Legacy Clothing | |
|---|---|
| Type of company | Sole proprietorship |
| Business purpose | Own and operate clothing/merchandise stores |
| Business location(s) |
Washington, D.C. Staff of 50 people |
Legacy Clothing needs financial statement analysis. There are two types of financial statement analysis, income statement analysis and balance sheet analysis, and Legacy Clothing needs both.
Income statement analysis is needed to help Legacy Clothing with trend analysis so they can identify trends. It is also helpful for assessing past performance and predicting future performance. Income statement analysis also provides a more complete picture for our financial statements. It helps us understand the relationship between expenses and revenues, the changing composition of our expenses over time, and it helps measure the results of expense management.
The other type of financial statement analysis is balance sheet analysis. This analysis is important because it helps with inventory management and to understand the flow of our merchandise, or how the inventory is flowing in the business. We don't want to have too much inventory, because there's going to be an increased cost associated with storing, protecting, and managing that inventory. If we have too little inventory, we might not be able to make our sales, because we don't have the items in stock.
Now that we've determined why Legacy Clothing needs to have financial statement analysis, let's look at performing financial statement analysis for them, starting with their income statement analysis.
The starting point for income statement analysis is going to be our income statement, so you'll see that we've prepared an income statement for our subject company.
Now we're ready to perform our analysis. The first thing that we're going to do is express our expenses as a percentage of our total sales. As you can see, our total sales of $990,000 represents 100%. Next, we will express our expenses as a percentage of that total sales number.

For instance, our cost of goods sold are 23% of total sales, salaries expense are 36% of total sales, etc.
Note, this analysis is beneficial for understanding the different relationships between the specific expenses and the total sales. It can help Legacy Clothing to understand the composition of their expenses and how those expenses change over time, including any trends that can be identified.
Now, let's look at performing another type of income statement analysis, calculating the gross margin ratio. As you can see below, the formula for calculating the gross margin ration is net sales minus cost of goods sold, divided by net sales.

We can populate that information from our income statement to calculate that our gross margin ratio is 76%, which tells us that our gross profit from our total sales is 76%.
Now, let's shift our focus to a balance sheet analysis, below, for Legacy Clothing. We will be calculating our inventory turnover, as well as our days inventory on hand or days in inventory, by using information from both the income statement and balance sheet.

Inventory turnover can be calculated one of two ways. The first method involves looking at net sales divided by inventory.

If we take our net sales and divide it by our ending inventory, this tells us that our inventory is sold 7.6 times during the period.
However, a more accurate way to calculate our inventory turnover is to look at our cost of goods sold and divide it by our average inventory, which speak more to period-based activity.

Therefore, we take our cost of goods sold and divide by the average of our beginning and ending inventory balance, we'll see that our inventory turnover is more accurately reflected as 1.7 times, which is the number of times inventory is sold during the period.
Now, if we perform a days inventory on hand or days in inventory calculation, this will tell us how many days our inventory is actually held.
We take the number of days in the period--in this case, 365, because we are looking at an annual period--and divide it by our inventory turnover ratio, the 1.7 that we just calculated.
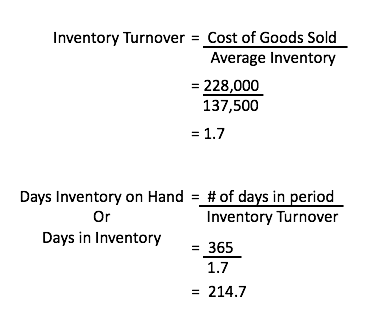
Now we can see that the number of days that Legacy Clothing holds their inventory is 214.7 days.
Source: Adapted from Sophia instructor Evan McLaughlin.