Table of Contents |
Slope-intercept form of a linear equation provides two useful pieces of information about the graph of the line: the slope of the line, and the location of the y-intercept. Slope-intercept form is  where m is the slope of the line, and b is the y-coordinate of the y-intercept. We know that all y-intercepts have an x-coordinate of 0, so the coordinate to the y-intercept is (0, b) in this form.
Recall that we only need two points in order to graph a line. Once we have two points plotted, we can connect the two points and extend the line in both directions.
EXAMPLE
Graph the line .
.
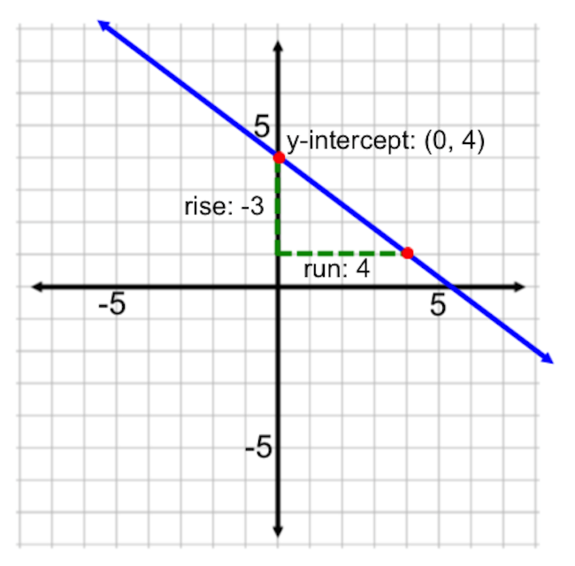
 . This tells us we have a rise of -3 and a run of 4. So starting at (0, 4), go down 3 and over to the right 4. We have another point at (4, 1). Plot this second point and connect the two points with a line.
When given the equation of a line in point-slope form, we follow a similar process as above: we can easily plot one point on the line from the equation. From there, we can use the slope to move vertically and horizontally to another point on the line, and then draw the line on the graph.
EXAMPLE
Graph the line .
.
 , where m is the slope and
  is a point on the line. From the equation , we can identify the slope as
  .
.
 . This means that if you see a positive value after y or x, the coordinate is actually a negative value. In the above equation, we have
  , which means the y-coordinate is actually -3. We also have
  which means the x-coordinate is actually -6. The point included on this line is
  .
.
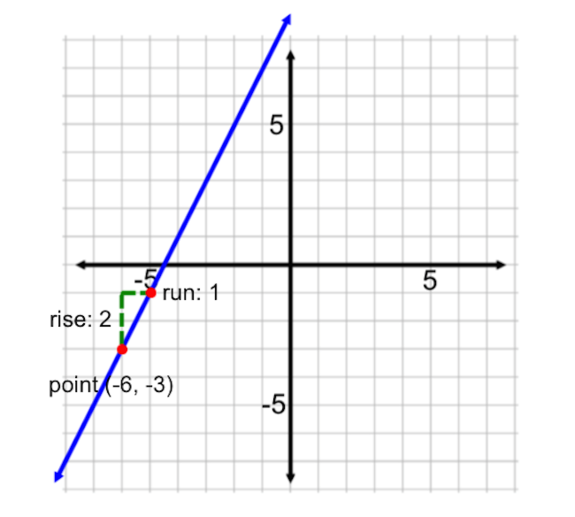
 . So the rise is 2 and the run is 1. From the point (-6, -3), go up 2 and over to the right 1 to get a second point at (-5, -1). Plot this second point and connect the two points with a line.
 , the point would be (-5,4). Here are a few more examples:
| Point-Slope Form | Point | Slope |
|---|---|---|

|
(5,2) | 12 |

|
(7,-9) | -3 |

|
(-6,1) |

|

|
(-4,-5) |

|
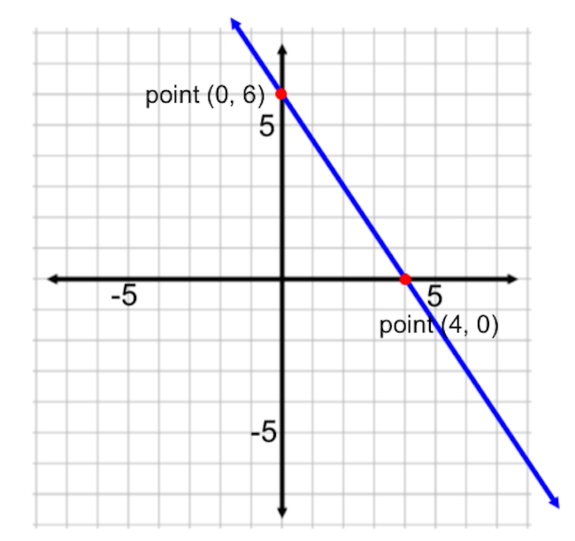
While the other two forms instantly provide information about the slope of a line, and either the y-intercept or some other point on the graph, equations written in standard form can seem unhelpful at first. However, standard form allows us to easily find the line's x- and y-intercepts. Recall that at our intercepts, either x or y will have a value of zero; and because we have both the x-term and the y-term in the equation, when one of x or y is zero, the entire term has a value of zero. This makes calculating intercepts rather easy, and if we can easily find both intercepts, we can easily graph the line.
EXAMPLE
Graph the line .
.
|
|
Using the standard form equation, plug 0 in for y and solve for x |

|
Evaluate 2 times 0 |

|
Divide both sides by 3 |

|
Use this value to find the coordinates of the x-intercept |

|
Coordinate of x-intercept |
|
|
Using the standard form equation, plug 0 in for x and solve for y |

|
Evaluate 3 times 0 |

|
Divide both sides by 2 |

|
Use this value to find the coordinates of the y-intercept |

|
Coordinate of y-intercept |
Source: ADAPTED FROM "BEGINNING AND INTERMEDIATE ALGEBRA" BY TYLER WALLACE, AN OPEN SOURCE TEXTBOOK AVAILABLE AT www.wallace.ccfaculty.org/book/book.html. License: Creative Commons Attribution 3.0 Unported License