Table of Contents |
More than likely, you'll be given a quadratic equation or inequality in standard form  . To graph this, it is helpful to find the vertex to the parabola, and then plot some points on one side of the vertex. Since the vertex lies on the axis of symmetry, we can simply reflect the already plotted points across this line, to create a more complete sketch of the parabola.
To find the vertex and/or axis of symmetry when working in standard form, we use the following formula, where  and b come from the coefficients of the x-squared and x-terms in standard form:

This formula is also the equation to the vertical line which is the axis of symmetry (for vertical parabolas). This also represents the x-coordinate of the vertex. To find the y-coordinate, simply use the calculated value of x in the original equation, and solve for y.
Graphing inequalities is similar to graphing equations, but there are some important differences. First, there is a difference between using a solid line and a dashed line to draw the curve. If the inequality symbol is strict ( < or >) we always use a dashed line to show that we are not including exact values on the boundary line. If the inequality symbol is non-strict ( ≤ or ≥ ) we always use a solid line to show that we are including exact values on the boundary line.
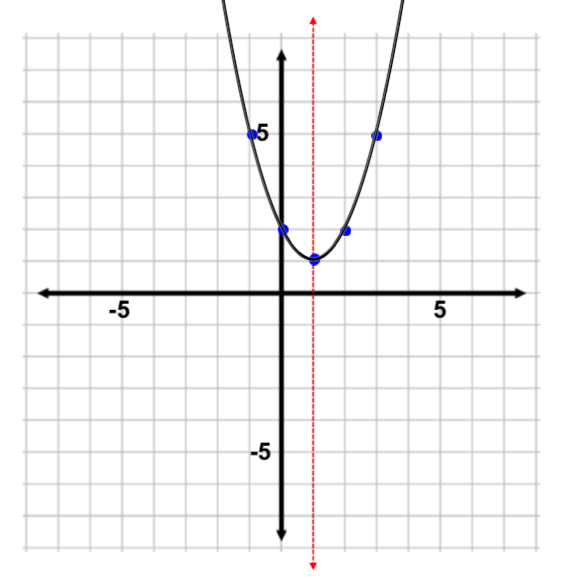
Not only do we need to be careful about what type of line to use when drawing the graph, but we also need to highlight a solution region. The highlighted solution region represents the set of all (x, y) coordinates that satisfy the inequality. To decide which inequality region to highlight, we use a test point. This test point can be anywhere on the coordinate plane, so long as it isn't on the boundary line (because that would not help us at all). We take the x- and y- values from this test point and plug it into our inequality. If the statement is true, the half-plane that the test point lies within is the solution region, and gets highlighted. If not, the other half-plane gets highlighted.
Let's apply what we know about graphing parabolas and graphing inequalities to graph a quadratic inequality.
EXAMPLE
Graph the inequality .
.
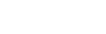
 . We will use a solid line to graph the parabola because our inequality symbol is non-strict. To graph the boundary line, we need to find the vertex, plot a couple of points, and then reflect them across the axis of symmetry:
and b in the standard form equation and then substitute those values into the formula for the x-coordinate of the vertex.
. We will use a solid line to graph the parabola because our inequality symbol is non-strict. To graph the boundary line, we need to find the vertex, plot a couple of points, and then reflect them across the axis of symmetry:
and b in the standard form equation and then substitute those values into the formula for the x-coordinate of the vertex.

|
Plug in the values  and and 
|

|
Evaluate |

|
Divide |

|
Simplify |

|
x-coordinate of the vertex |
to draw the axis of symmetry. We can also use this to find the y-coordinate of the vertex:
|
|
Substitute 1 in for x |

|
Evaluate |

|
Simplify |

|
y-coordinate of vertex |
| x |
|
(x, y) |
|---|---|---|
| 2 |

|
(2, 2) |
| 3 |

|
(3, 5) |
| 4 |

|
(4, 10) |
|
|
Plug in the point (0, 0) into the original inequality |

|
Evaluate |

|
Simplify |

|
False statement |
Source: ADAPTED FROM "BEGINNING AND INTERMEDIATE ALGEBRA" BY TYLER WALLACE, AN OPEN SOURCE TEXTBOOK AVAILABLE AT www.wallace.ccfaculty.org/book/book.html. License: Creative Commons Attribution 3.0 Unported License
