This tutorial will explain interpreting the intercept and slope of a regression line. Our discussion breaks down as follows:
1. Interpreting Slope
A slope is a rate of change. You've talked about rates of change a lot in everyday life.
|
Rates of Change
|
Application
|
|
Miles Per Hour
|
If a car's driving at 50 miles per hour, how much farther can you go by driving one additional hour? 50 miles per hour means 50 miles every hour. So, one additional hour means 50 additional miles.
|
|
Dollars Per Pound
|
If a fisherman is paid $4.04 per pound for sea scallops, how much more money do the fishermen stand to make by catching one additional pound of scallops? Well, $4.04 per pound, so every additional pound means $4.04 additional money.
|
When looking at the regression line formula, the slope is represented by b1 and multiplied by the explanatory variable, x, to find the average rate of change.

On a scatterplot, you know that there are actual data points on there, so you can calculate the rates of change between two data points. However, you’re only interested in the average over all the points. That is the average increase or decrease in the response variable that corresponds to an increase of one in the explanatory variable.
-
EXAMPLE
Suppose you had the following equation where distance-hat equals 15 times time, where time is in hours and distance is in miles.

The 15 in the equation would be 15 miles per hour. But because this is a regression equation, the 15 is an average speed. There's no guarantee that you go 15 miles every single hour. What this indicates is that,
on average, for each additional hour in time, the distance increases by 15 miles.
-
EXAMPLE
This chart details the miles and airfare from the Minneapolis/Saint Paul airport to various destinations.
|
Destination
|
Miles
|
Airfare
|
|
Boston
|
1,266
|
263
|
|
Charleston
|
1,294
|
306
|
|
Chicago
|
407
|
128
|
|
Denver
|
834
|
212
|
|
Detroit
|
611
|
261
|
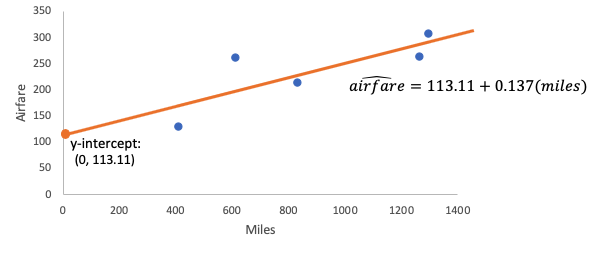
The equation of the regression line would be airfare-hat, which is the predicted airfare, equals 113.11 plus 0.137 times miles.

What do those values mean?
The 0.137 times miles is the slope, which is the rate of change. It's how quickly the airfare changes if you increase the miles by one. So, for each additional mile, the airfare is predicted to increase by 0.137 dollars or 13.7 cents.
-
There are a couple of important ideas to note as you interpret these values:
- It's for every additional mile. You can't leave this word out. You can't say for every mile because it has to do with the fact that it doesn't start at zero miles costing zero dollars.
- You have to say it's a predicted increase. Using airfare-hat, we're not figuring out actual airfares. Remember this is an average. We're using it to predict the additional airfare for each mile. It's not a hard and fast rule, and that's why it can be used to predict airfare but not to actually assign airfares.
- Lastly, we're using units--miles and dollars. You can't say airfare increases by 0.137. You must specify the unit assigned to 0.137. It's 0.137 dollars. For each additional mile, it is increased by this many dollars.
-
- Slope of Regression Line
- The amount y changes (on average) for a one unit increase in x.
2. Interpreting Y-Intercept
The y-intercept of a regression line is the expected value of y if x is equal to 0. When looking at the regression line formula, the y-intercept is represented by b0:

Sometimes when you are trying to interpret the y-intercept, it may not make the most sense. It could be the case where x equals 0 seems unreasonable, or the x-values in your data set are far from 0.
-
EXAMPLE
Let's consider the same equation from above:

The y-intercept here is 113.11. The y-intercept is the value of y, which is the response variable (airfare), when the value of x, which is the explanatory variable (miles), is zero. When a flight is zero miles, which is when the explanatory variable is zero, the airfare is predicted to be $113.11.
Remember, you're talking about an ordered pair. So, it's zero miles and $113.11. You need to have both those numbers in there because this number really corresponds to an ordered pair on the graph.

Secondly, just like how the slope was a prediction, the y-intercept is also a prediction. Now, it's not a meaningful prediction, but it's a prediction. It's because this line is a prediction line; it's a best-fit line. It's not actually finding airfares for us.
Make sure you include units.
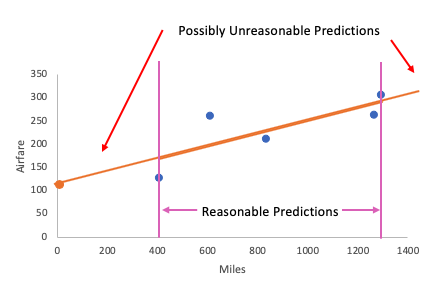
Here, the y-intercept didn't make a lot of contextual sense. You wouldn't buy a ticket for $113.11 just to go nowhere. The reason has to do with the range of miles values for which this line is an appropriate airfare guess.
What we have here is miles values from 407 up to almost 1,300 miles. This means that we can use this line within that range of 407 to 1,294 to make reasonable predictions on airfare. If we wanted to go to San Antonio, for instance, we could certainly use this line to do that, because the distance from Minneapolis to San Antonio is within this range. Therefore, it's reasonable to use this line to make predictions within this 400 to 1,300 range.
|
Destination
|
Miles
|
Airfare
|
|
Boston
|
1,266
|
263
|
|
Charleston
|
1,294
|
306
|
|
Chicago
|
407
|
128
|
|
Denver
|
834
|
212
|
|
Detroit
|
611
|
261
|

|
Anything outside of that range might not be reasonable. Sometimes we need to acknowledge the fact that perhaps the y-intercept isn't part of that reasonable prediction range, so it might not have much contextual sense. It's still a good idea to know how to interpret it.}}
-
Try this one on your own. Interpret the slope and y-intercept involving sodium content and calories for certain hot dogs.

You should have identified the 160 as the y-intercept, meaning if a hot dog had zero calories, then the predicted sodium would be 160 milligrams.
The 2.5 is the slope, which means that for each additional calorie a hot dog has, the sodium content is predicted to increase by 2.5 milligrams. Remember that 2.5 milligram per calorie increase is an average. This is not a hard and fast rule.
-
- Y-Intercept of Regression Line
- The expected y value when x = 0
The slope is a rate of change, and it explains how an increase in the explanatory variable affects the response variable. The y-intercept shows you what's predicted for the response when the explanatory value is zero. Sometimes, it doesn't have a meaningful interpretation because it falls outside the reasonable predictions window, but it is still important to know how to interpret it.
Good luck!


