This tutorial is going to introduce you to what a sampling distribution is. You’ll learn about:
Let’s start with an example of sampling distribution.
Sampling Distribution of Sample Means
A distribution that shows the means from all possible samples of a given size.
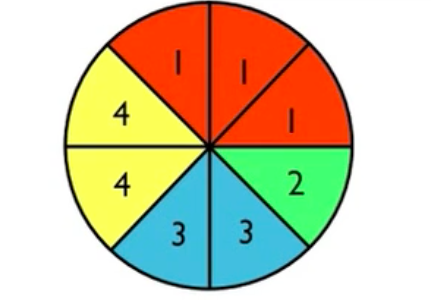
Consider the spinner shown here:
Spin it four times to obtain an average. Imagine that you spin it for one set of four. You get a 2 the first time, a 4 the second time, a 3 the third time, and a 1 the fourth time. The mean is the average of 2, 4, 3, and 1: 2+4+3+1 = 10, 10/4 = 2.5. So your first mean is 2.5.
But your mean won't be 2.5 every time:
Sample |
Numbers |
Average |
1 |
2, 4, 3, 1 |
2.5 |
2 |
1, 4, 3, 1 |
2.25 |
3 |
4, 2, 4, 4 |
3.5 |
4 |
2, 2, 3, 1 |
2 |
5 |
3, 1, 1, 1 |
1.5 |
6 |
1, 1, 1, 2 |
1.25 |
So how can we represent all these distributions?
1. First, these sample means and graph them. Draw out an axis, for this one it should go from 0 to 4 because this set can’t average anything higher than four or lower than a one.
2. Take the average value, the mean of 2.5, and put a dot at 2.5 on the x-axis, much like a dot plot.
3. Do the same for all the means.
You can keep doing this over and over and over again. Ideally, you would do this hundreds or thousands of times, to show the distribution of all possible samples that could be taken of size four.
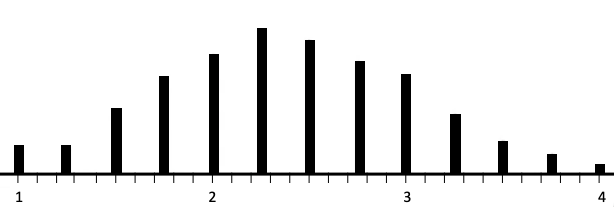
4. Once you’ve enumerated every possible sample of size 4 from this spinner, then the sampling distribution looks like this:
Notice the lowest number you can get is one and the highest number you can get is four. On the far right of the graph is the point that represents a spin of four fours. On the far left is the point that represents a spin of four ones.
In the middle, notice that there are more dots because there were more ones on the spinner than there were fours. And because there were more ones, the average is pulled down a bit. The most frequent average is 2.25, not 2.5, which would be the exact middle between 1 and 4. So this distribution is skewed slightly to the right.
A sampling distribution is the distribution of all possible means that you could have for a given size. So in a sampling distribution where you graph all the possible means for samples of size 4, you take the sample, calculate the mean, and plot it with a dot. Then you take another sample, calculate the mean again, and plot that. So it can be a long and tedious process! In large populations, the sampling distribution consists of lots and lots and lots of points.
Thank you and good luck!
Source: THIS WORK IS ADAPTED FROM SOPHIA AUTHOR JONATHAN OSTERS
A distribution that shows the means from all possible samples of a given size.