Table of Contents |
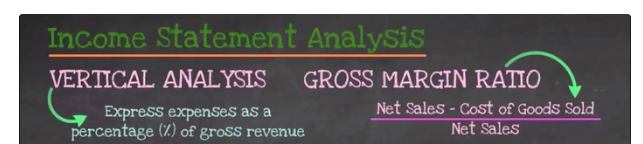
One type of income statement analysis is vertical analysis, which is expressing expenses as a percentage of gross revenue.
Another type of income statement analysis that we can perform is calculating the gross margin ratio, which is expressed as net sales minus cost of goods sold, divided by net sales.
Performing income statement analysis is important for many reasons:
Businesses use it in the same way, to understand where they're spending their money.
Let's look at an example of performing an income statement analysis.
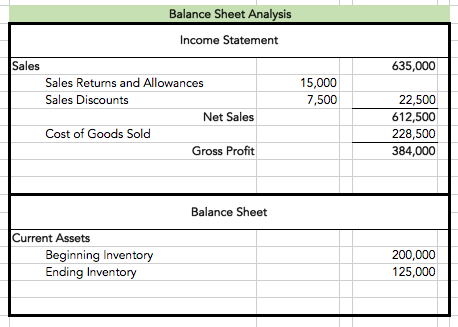
We're going to start by performing a vertical analysis. As mentioned above, vertical analysis is expressing our expenses as a percentage of our total gross revenue. Using the income statement below, our total revenue or total sales of $635,000 is going to represent 100%.
Then, we take all of the expense items and express them as a percentage of that total sales number.
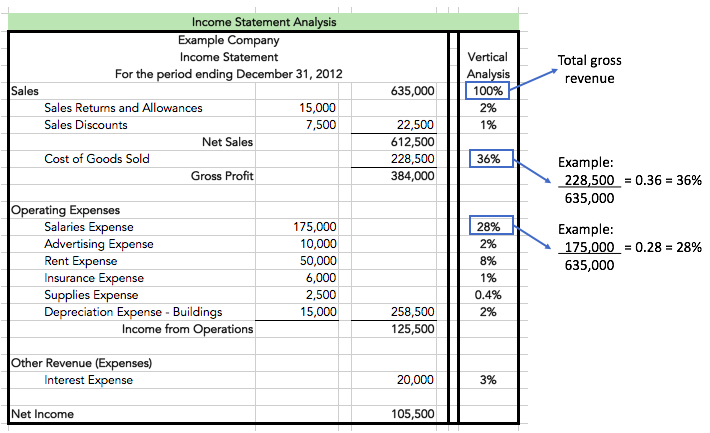
As you can see, cost of goods sold is 36% of total sales, salaries expense is 28% of our total sales, etc.
Again, this analysis helps us to understand the composition of our expenses, the relationship between expenses and revenues and allows us to measure the results of any expense management if, for instance, we're trying to bring our salaries down.
Next, let's turn our attention to calculating the gross margin ratio. Below you will see some information that we need from our income statement. Remember, the gross margin ratio formula is net sales minus cost of goods sold, divided by net sales.

Therefore, if we take our net sales of $612,500 and subtract out cost of goods sold ($228,500), this equals $384,000, or gross profit.
Now, if we divide that number by net sales, this gives us 63%. In this case, our gross margin, meaning gross profit as a percentage of net sales, is 63%.
Now that we've seen how to perform income statement analysis for a merchandising company, let's discuss balance sheet analysis. We will focus on inventory turnover analysis, which is how often a business buys, sells, and replaces inventory, meaning the periodic changes in the inventory.
Performing an inventory turnover analysis is important for many reasons:
There are multiple calculations involved in an inventory turnover analysis:
1. Inventory Turnover
The calculation for inventory turnover is net sales divided by inventory, but it can also be calculated by taking cost of goods sold and dividing by average inventory.
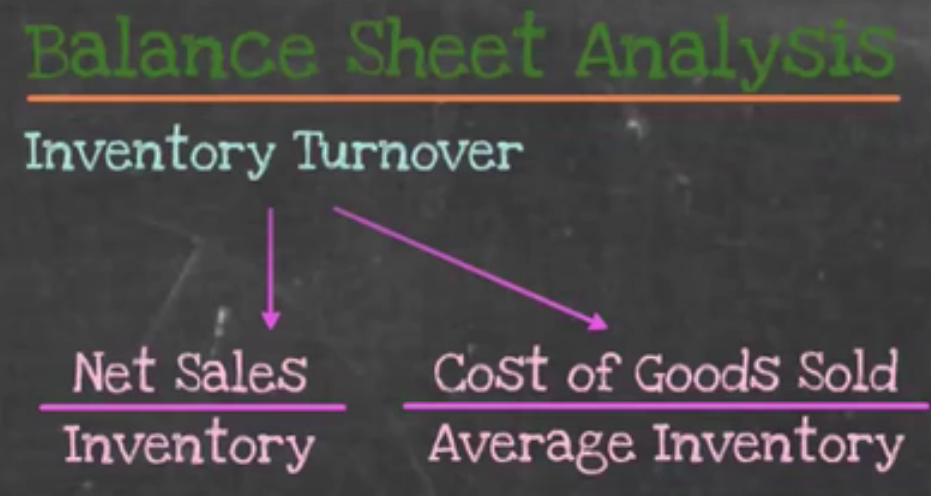
This second formula is probably a better indicator because these are both period-based items. It's going to look at the entire period in terms of inventory turnover rather than a point in time like the first formula.
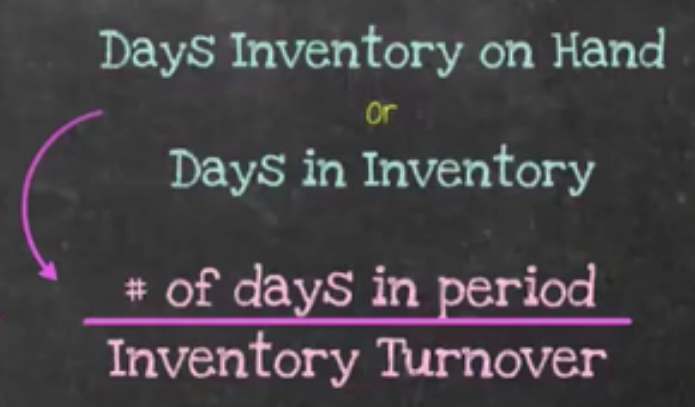
2. Days Inventory on Hand, or Days in Inventory
The other calculation mentioned is days inventory on hand, also known as days in inventory. In this formula, we take the number of days in the period--for an annual period, 365 days--and divide by the inventory turnover ratio that we just calculated.
Now, let's take these two analyses--inventory turnover and days inventory on hand--and look at an example of performing balance sheet analysis.
Below is the balance sheet analysis, and we're going to start by calculating our inventory turnover ratios. There are two different ways to accomplish this, so as you can see, we've pulled the information that we need from the income statement and the balance sheet in order to perform these analyses.
For the first inventory turnover calculation, we take our net sales from the income statement, and divide by the ending inventory from the balance sheet.
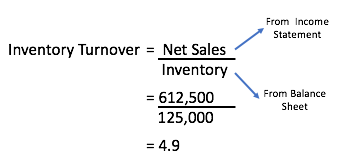
This gives us 4.9 as the number of times the inventory was sold during the period.
However, for the second calculation, we can use period-based items like cost of goods sold from the income statement, in addition to averaging our inventory. To do this, we take our beginning inventory and ending inventory to calculate the average inventory for the period.
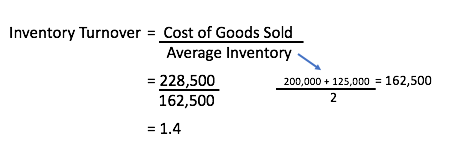
Cost of goods sold divided by average inventory gives us an inventory turnover ratio of 1.4 times. This indicates that our inventory is only turning over 1.4 times, meaning we're only selling our inventory 1.4 times during the period.
Now we want to calculate our days inventory on hand or days in inventory.
To do this, we will need the inventory turnover ratio we just calculated, which is 1.4 times. We also need the number of days in the period; in this case, we're going to assume that we are looking at the entire year, or 365 days.
We take the number of days in the period, 365, and divide by our inventory turnover ratio of 1.4.
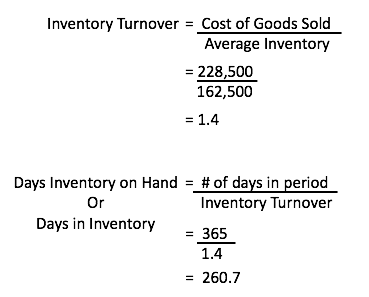
This informs us that 260.7 days is the number of days it takes us to sell our average inventory.
Source: Adapted from Sophia instructor Evan McLaughlin.