In this tutorial, you're going to learn about the power of a hypothesis test. Specifically you will focus on:
You might wonder, what is power? Power is the ability of a hypothesis test to detect a difference that is present.
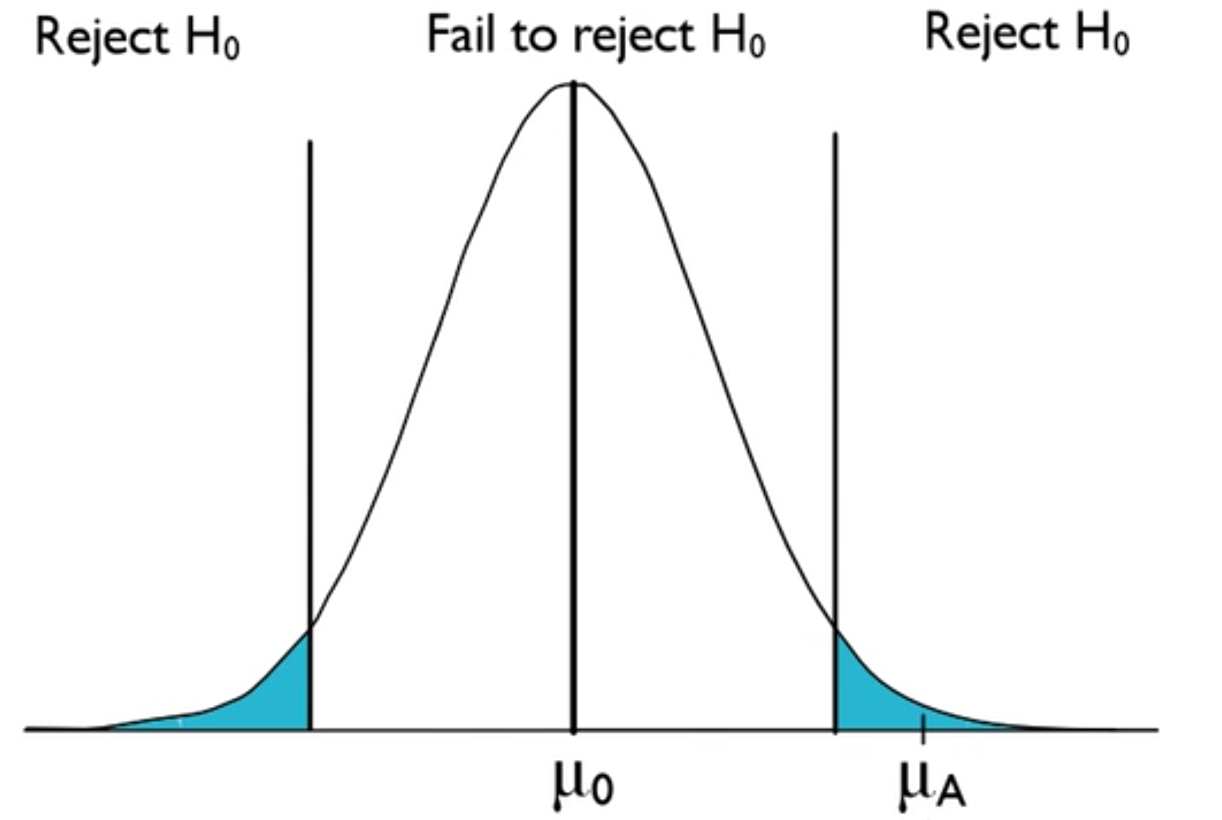
This is the standard null hypothesis curve.
The mean from the null hypothesis is in the middle, and there are two tails, two rejection regions, where you either reject the null hypothesis or fail to reject the null hypothesis. These are your lines in the sand for a two sided test.
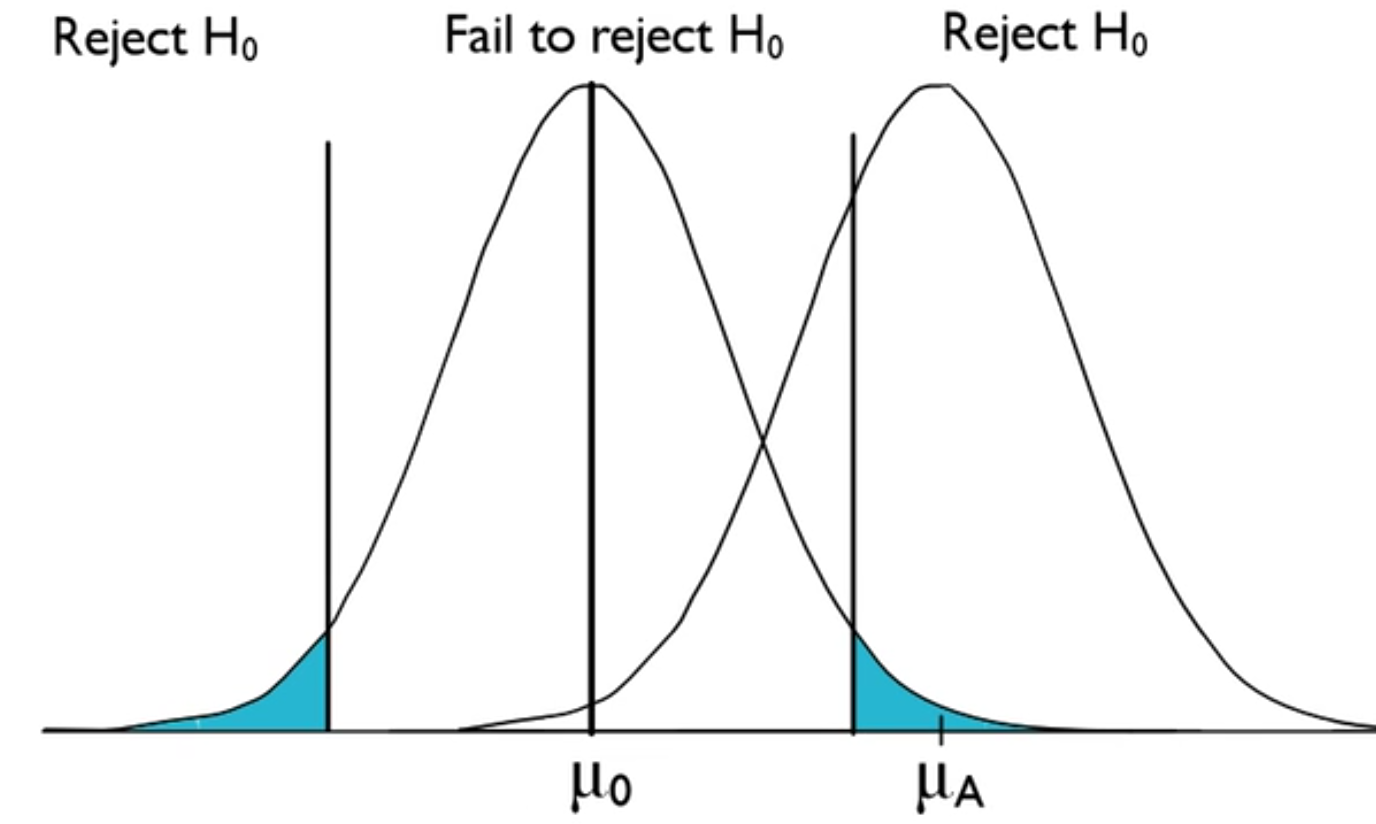
Suppose that the mean is actually all the way to the right.
That means that because the mean is actually different than the one from the null hypothesis, you should reject the null hypothesis. What you end up with is an identical curve to the original normal curve.
If you take a look at this curve, the way the data is actually behaving, this is the way you thought it should behave based on the null hypothesis, but this is the way the data is actually going to behave.
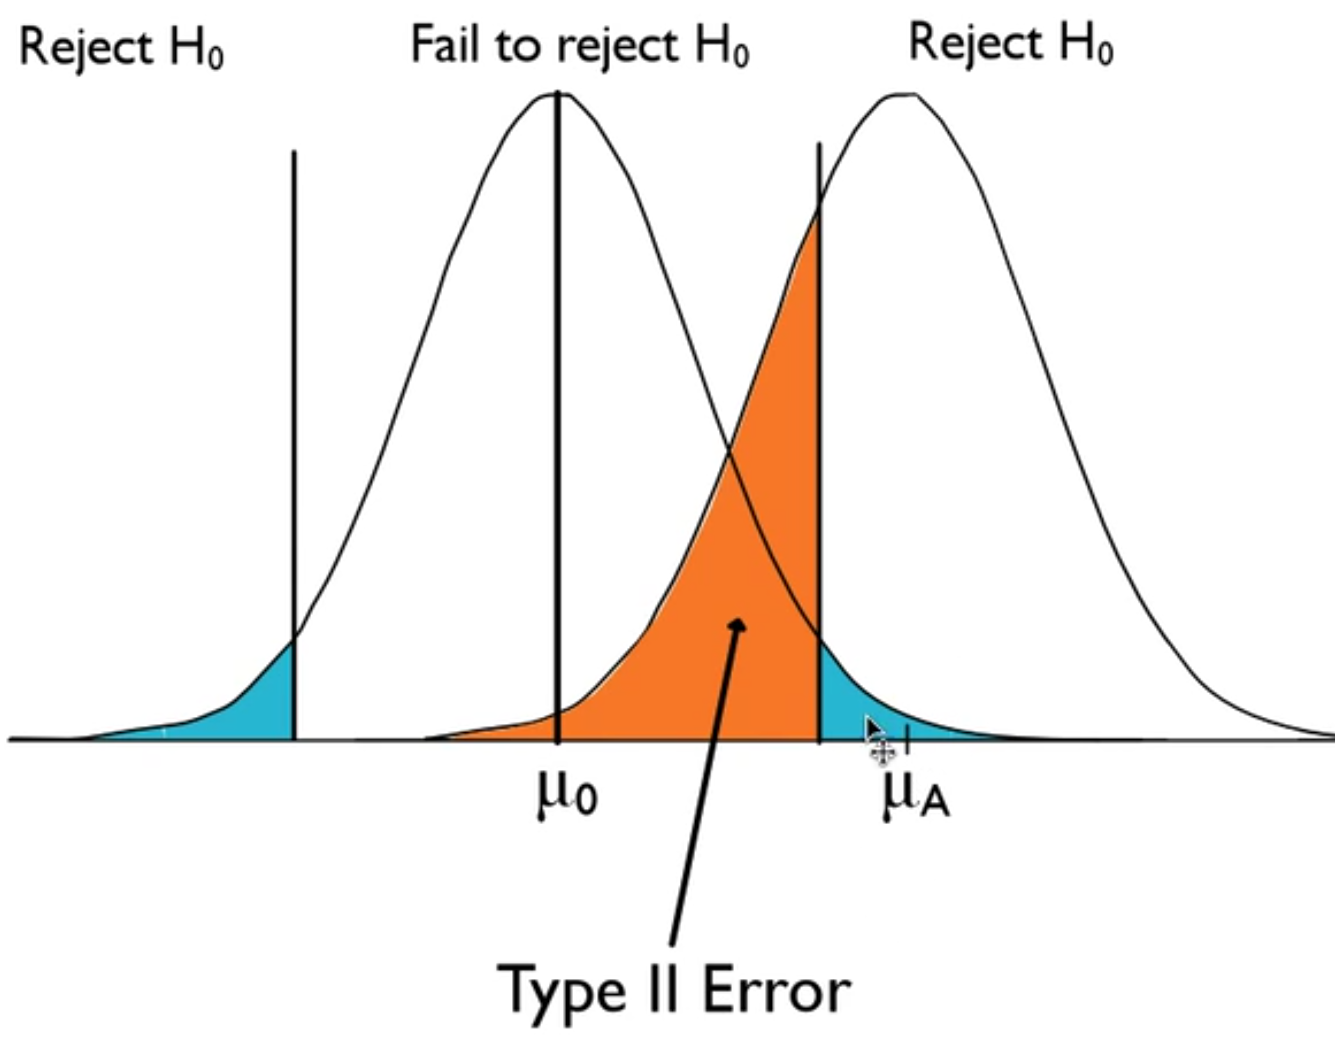
This line in the sand still exists, which means that because we should reject the null hypothesis, this area in orange is a mistake.
Failing to reject the null hypothesis, being to the left of the line in the sand, is wrong, if this is actually the mean, which is different from the null hypothesis' mean. This is a type II error.
The area in yellow on the other side, where you are correctly rejecting the null hypothesis when a difference is present, is called power.

Power is the probability of rejecting the null hypothesis correctly, Rejecting when the null hypothesis is false, which is a correct decision.

There are two main ways to increase the power of the significance test. One is by increasing the sample size, which then decreases the standard error of the distribution, or you can increase the significance level, alpha.
You can see that the second graph is skinnier than before. Now there is less orange space, and a lot more yellow space. In order to make the curves skinnier, you decrease their standard deviation. The standard error is the standard deviation of, in this case, x bar.
How do you decrease the standard error? It was sigma over the square root of n, which means if you make n bigger, because it's in the denominator, the standard error will go down, which means that these will have less spread, and there will be less overlap of this curve with that curve.
The problem with increasing sample size is that you might have logistical constraints, like time or money. You have to make those decisions, if you are the person actually doing the sampling. But if you increase the sample size, and it's worth it to you, then go ahead and do it, because that will increase the power of the test.
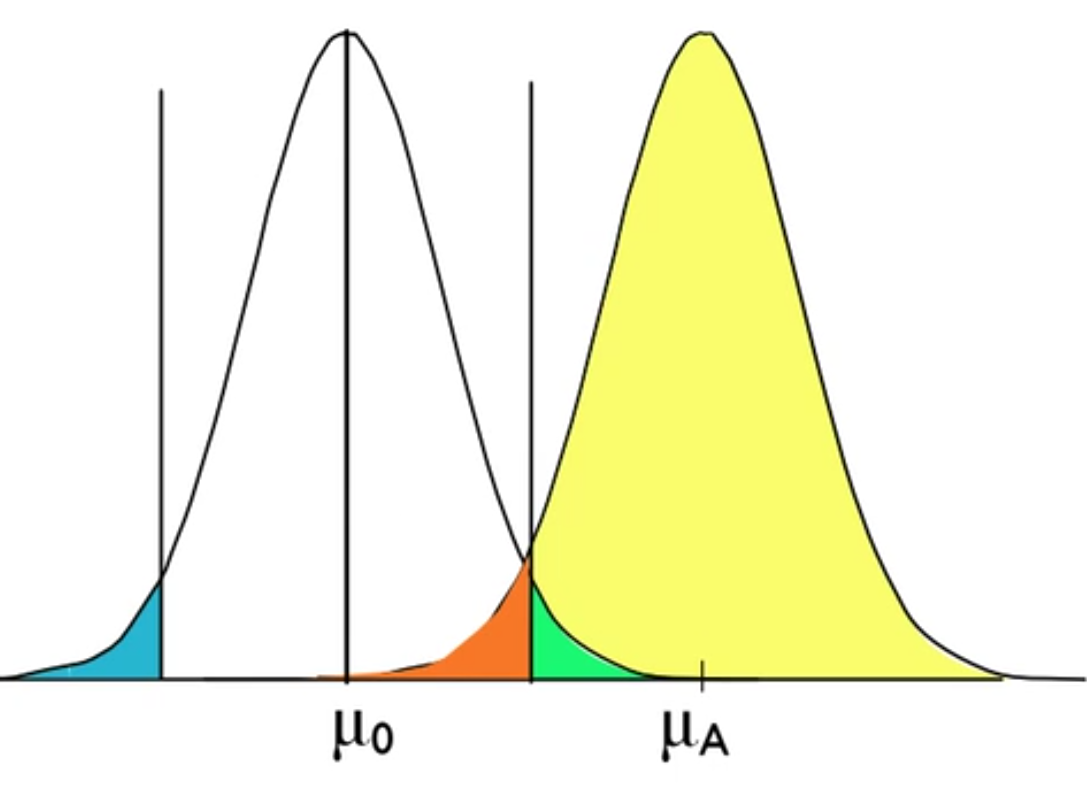
Suppose you didn't change it and kept the sample size the same. What else is there to do to increase the amount of yellow space and decrease the amount of orange space? You could actually just literally move the critical value in closer to mu from the null hypothesis. You could move the critical values, these gates, in.
Take a look:
Notice the amount of blue space increased. Notice the amount of yellow space is also bigger than it was before.
By doing this, you actually increased the amount of blue area, which means that you increased the significance level. The significance level is the probability of a type I error. You're actually just trading out one error for the other. By decreasing the amount of orange space, you're decreasing the probability of a type II error, but you're increasing the probability of a type I error. In certain situations, you have to make that decision as to whether or not that is actually worth it.

The power of a significance test is the probability that the null hypothesis is rejected, given that it is really false. You're using the alternate normal curve, as opposed to the one from the null hypothesis.
There are two main ways to increase the power of the significance test. One is by increasing the sample size, which then decreases the standard error of the distribution, or you can increase the significance level, alpha. Both of these have benefits, by increasing the power, but they both have negative trade offs.
Good luck.
Source: This work adapted from Sophia Author Jonathan Osters.