Use Sophia to knock out your gen-ed requirements quickly and affordably. Learn more
×

Test Statistic

Author: Sophia

what's covered
This tutorial will cover the topic of test statistics, which is the statistic that we calculate using the statistics that we already have when we're running a hypothesis test. The tutorial will cover how to determine whether to reject a null hypothesis from a given p-value and significance level. Our discussion breaks down as follows:

Table of Contents

1. Test Statistics

A test statistic is a measure that quantifies the difference between the observed data and what is expected under the null hypothesis. It is expressed in terms of how many standard deviations an observed mean or proportion is what would be expected by the null hypothesis.

When we have a hypothesized value for the parameter from the null hypothesis, we might get a statistic that's different than that number. So, it's how far it is from that parameter.

big idea
Essentially, a test statistic is a z-statistic or a z-score.

The basic test statistic formula is equal to the statistic minus the parameter, divided by the standard deviation of the statistic.

formula to know
Test Statistic
fraction numerator s t a t i s t i c minus p a r a m e t e r over denominator s t a n d a r d space d e v i a t i o n space o f space s t a t i s t i c end fraction

term to know
Test Statistic
A measurement, in standardized units, of how far a sample statistic is from the assumed parameter if the null hypothesis is true

1a. Z-Statistic for Means

When dealing with means, we can use the following values:

Z-Statistic for Means
Statistic Sample Mean: x with bar on top
Parameter Hypothesized Population Mean: mu
Standard Deviation Standard Deviation of x with bar on top: fraction numerator sigma over denominator square root of n end fraction

Therefore, the z-statistic for sample means that you can calculate is your test statistic, and it is equal to x-bar minus mu (μ), divided by the standard deviation of x-bar. Now we will start formalizing its use and be able to tackle those edge case scenarios where the means are moderately far apart.

formula to know
Z-Statistic of Means
z equals fraction numerator x with bar on top minus mu over denominator begin display style fraction numerator sigma over denominator square root of n end fraction end style end fraction

1b. Z-Statistic for Proportions

Meanwhile, for proportions, we can use the following values:

Z-Statistic for Proportions
Statistic Sample Proportion: p with hat on top
Parameter Hypothesized Population Proportion: p
Standard Deviation Standard Deviation of p with hat on top: square root of fraction numerator p q over denominator n end fraction end root

hint
The standard deviation of the p-hat statistic is going to be the square root of p times q (which is 1 minus p) over n.

Therefore, the z-statistic for sample proportions that you can calculate is your test statistic, and it is equal to p-hat minus p from the null hypothesis, divided by the standard deviation of p-hat.

formula to know
Z-Statistic of Proportions
z equals fraction numerator p with hat on top minus p over denominator square root of begin display style fraction numerator p q over denominator n end fraction end style end root end fraction

2. P-Value

Both these situations have conditions under which they're normally distributed. You can use the normal distribution to analyze and make a decision about the null hypothesis.

The normal curve below operates under the assumption that the null hypothesis is, in fact, true.

Normal Curve

Suppose you are dealing with means. In the following graph, the parameter mean is indicated by mu (μ), the standard deviation of the sampling distribution is sigma over the square root of n, and perhaps your statistic x-bar is over to the right as indicated below. The test statistic will become a z-score of means.

Distribution Showing Z-Statistic of One-Sided Test

You are going to find what is called a p-value, the probability that you would get an x-bar at least as high as what you'd get if the mean really is over here at the mean, mu (μ). In this particular case, it's one sided-test.

We could do that, or if it were a two-sided test, it would look like this:

Distribution Showing Z-Statistic of Two-Sided Test

try it
A researcher is studying the effect of a new medication on blood pressure. The null hypothesis is that the medication has no effect on blood pressure.
The researcher conducts a study and gets a p-value of 0.038. If the significance level is 0.05, should the researcher reject the null hypothesis?
A p-value of 0.038 corresponds to a result we would expect to occur 3.8% of the time if the null hypothesis were true. This is more extreme than 5%, so we can reject the null hypothesis

A psychologist is studying the effect of a new therapy method on reducing anxiety levels. The null hypothesis is that the new therapy method has no effect on reducing anxiety levels.
The psychologist conducts a study and gets a p-value of 0.08. If the significance level is 0.10, should the psychologist reject the null hypothesis?
A p-value of 0.08 corresponds to a result we would expect to occur 8% of the time if the null hypothesis were true. This is more extreme than 10%, so we can reject the null hypothesis

big idea
Remember, if the p-value is less than or equal to the significance level, we reject the null hypothesis. If the p-value is greater than the significance level, we fail to reject the null hypothesis. This is because a smaller p-value indicates stronger evidence against the null hypothesis.

term to know

p-value
The probability that the test statistic is that value or more extreme in the direction of the alternative hypothesis

3. Critical Value

A common and related way to determine statistical significance is to compare your z-score to what's called a critical value. This corresponds to the number of standard deviations away from the mean that you're willing to attribute to chance.

EXAMPLE

You might say that anything within this green area here is a typical value for x-bar.
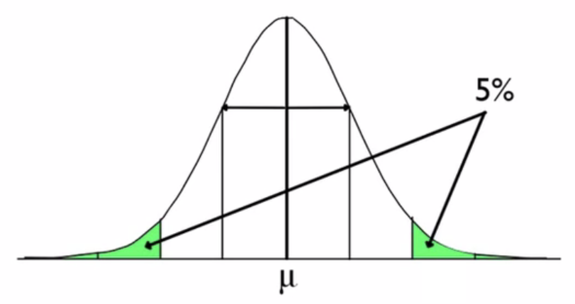
File:5121-test6.png
You are willing to attribute any deviations from mu (μ) to chance if it's in this green region. This is the most typical 95 percent of values. If it's outside that region, it would be within the most unusual 5%. You would be more willing to reject the null hypothesis in that case.

A test statistic, meaning a z-statistic, that's far from 0 provides evidence against the null hypothesis. One way would be to say that if it's farther than two standard deviations, which means it's in the outermost 5%, then you're going to reject the null hypothesis. If it's in the most innermost 95 percent, you will fail to reject the null hypothesis.
5% Rejection Curve

With two-tailed tests like the image above, the critical values are actually symmetric around the mean. That means that if you use positive 2 (1.96) on the right side, you would be using negative 2 (-1.96) on the left side.

There are some very common critical values that we use. The most common cutoff points are at 5%, 1%, and 10%, and you can see their corresponding critical values, which is the number of standard deviations away from the mean that you're willing to attribute to chance.

Tail Area
Two-Tailed One-Tailed Critical Value (z*)
0.05 0.025 1.960
0.10 0.05 1.645
0.20 0.10 1.282
0.01 0.005 2.576
0.02 0.01 2.326

For a two-tailed with 0.05 as your significance level, you will consider a result to be significant if the z-score is at least 1.96 standard deviations from the expected value.

If you were doing a one-tailed test with 0.05 as your significance level or a two-tailed test with rejecting the null hypothesis if it's among the most 10% extreme values, you'd use a z-statistic critical value of 1.645.

If you were doing a one-tailed test and you wanted to reject the most extreme 10% of values on one side, you'd use 1.282 for your critical value.

When you run a hypothesis test with the critical value, you should state it as a decision rule. For instance, you would say something like, "I will reject the null hypothesis if the test statistic, z, is greater than 2.33". That's the same as saying that on a right-tailed test, reject the null hypothesis if the sample mean is among the highest 1% of all sample means that would occur by chance. Note this is one-tailed because you're saying that the rejection region is on the high side of the normal curve.

Consider the curve below:

Curve

  • The area within the blue box is what you're not willing to attribute to chance.
  • The area within the red box is what you are willing to attribute to chance.
The decision rule, the area where the red and blue boxes overlap, is your line in the sand. Anything less than that will fail to reject the null hypothesis and attribute whatever differences exist for a mu (μ) to chance. Anything higher than 2.33 for a test statistic, you will reject the null hypothesis and not attribute the difference from mu (μ) to chance.

term to know
Critical Value
A value that can be compared to the test statistic to decide the outcome of a hypothesis test

summary
We learned about test statistics, both of which were z's. We also learned about p-values, which were the probabilities that you would get a statistic as extreme as what you got by chance, and the critical values, which are our lines in the sand whereby if we exceed that number with our test statistic, we'll reject the null hypothesis. When we are running a hypothesis test, we convert our sample statistic obtained (either x-bar or p-hat) into a test statistic, both of which are z's. If the sampling distribution is approximately normal, we can use the normal distribution to determine if our sample statistic is unusual or not--unusually high or unusually low or just unusually different--given that the null hypothesis is true. We can decide on different critical values for different levels of "unusual", where if our test statistic exceeds the critical value, we reject the null hypothesis--and that's our decision rule

Good luck!

Source: THIS TUTORIAL WAS AUTHORED BY JONATHAN OSTERS FOR SOPHIA LEARNING. PLEASE SEE OUR TERMS OF USE.

Terms to Know
Critical Value

A value that can be compared to the test statistic to decide the outcome of a hypothesis test

P-value

The probability that the test statistic is that value or more extreme in the direction of the alternative hypothesis

Test Statistic

A measurement, in standardized units, of how far a sample statistic is from the assumed parameter if the null hypothesis is true

Formulas to Know
Test Statistic

fraction numerator s t a t i s t i c space minus space p a r a m e t e r over denominator s tan d a r d space d e v i a t i o n space o f space s t a t i s t i c end fraction

z-statistic of Means

z space equals space fraction numerator x with bar on top space minus space mu over denominator begin display style bevelled fraction numerator sigma over denominator square root of n end fraction end style end fraction

z-statistic of Proportions

z space equals space fraction numerator p with hat on top space minus space p over denominator square root of begin display style bevelled fraction numerator p q over denominator n end fraction end style end root end fraction