Table of Contents |
Many event planners and project managers that put on events have a certain budget they must stick to. This budget represents the maximum amount of dollars that you can spend on the event or project.
EXAMPLE
Suppose that you are an event planner with a certain budget planning a company's promotional event. One of the company's board members wants as many balloons at the party as possible. You would like to meet the client's desires, but you have already dedicated $1730 of your budget to other expenses. After researching the cost of balloons, you figure out that each balloon will cost about $1.30 in all - this factors in the purchase of each balloon and the helium for the tank.
To graph the inequality for a situation, we need to analyze the inequality symbol. Inequality signs that include "or equal to" are drawn with a solid line on the graph, to show the inclusion of the exact values that the line graphs. If the symbol does not include "or equal to", then we use a dashed line to show that we are not accepted the exact values on the line as solutions to our inequality.
EXAMPLE
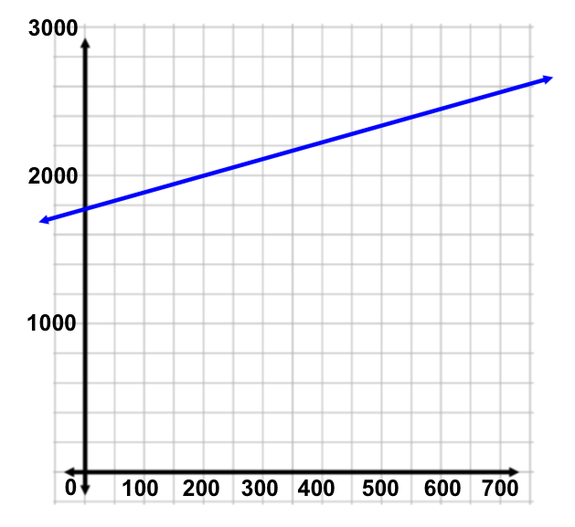
Graph the linear inequality for the scenario above. . We also draw this as a solid line because the inequality has a "greater than or equal to" symbol.
|
|
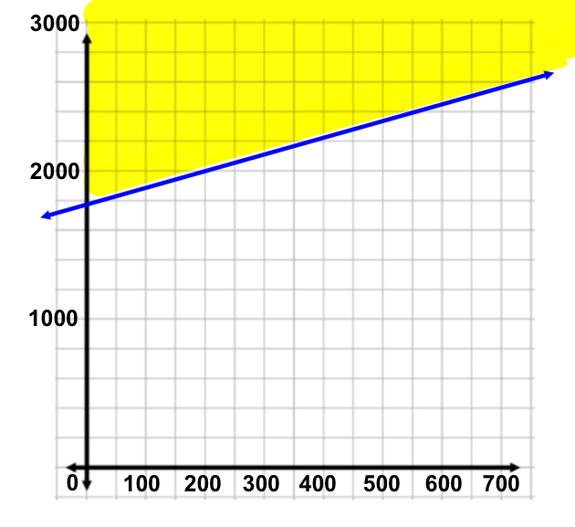
Using the inequality, substitute 0 in for x and 0 in for y |

|
Multiply 1.30 and 0 |

|
Add 0 and 1730 |

|
False statement |
 and
and  are often natural boundaries (we cannot buy negative balloons, and our budget cannot be negative dollars). This is why the negative sides of both x- and y-axis on the coordinate plane are not part of the solution region)
You can then use a graph and an inequality to answer questions about a specific scenario. Let's continue using the information in the scenario from above to answer the following questions.
EXAMPLE
Can we afford to purchase 700 balloons for the event with a budget of $2500?|
|
Using the inequality, substitute 700 in for x and 2500 for y |

|
Multiply 1.30 and 700 |

|
Add 910 and 1730 |

|
False statement |
EXAMPLE
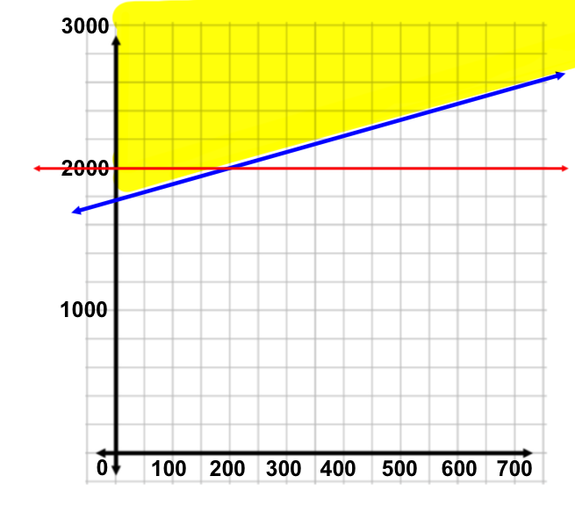
How many balloons can we purchase with a budget of $2000? and find where the line intersections the boundary line. This would represent the maximum number of balloons we can buy with a budget of $2000.
|
|
Using the inequality, substitute 2000 in for y |

|
Subtract 1730 from both sides |

|
Divide both sides by 1.3 |

|
Our solution |
Source: ADAPTED FROM "BEGINNING AND INTERMEDIATE ALGEBRA" BY TYLER WALLACE, AN OPEN SOURCE TEXTBOOK AVAILABLE AT www.wallace.ccfaculty.org/book/book.html. License: Creative Commons Attribution 3.0 Unported License